SCADA V10 Analyzing and Optimizing

product description
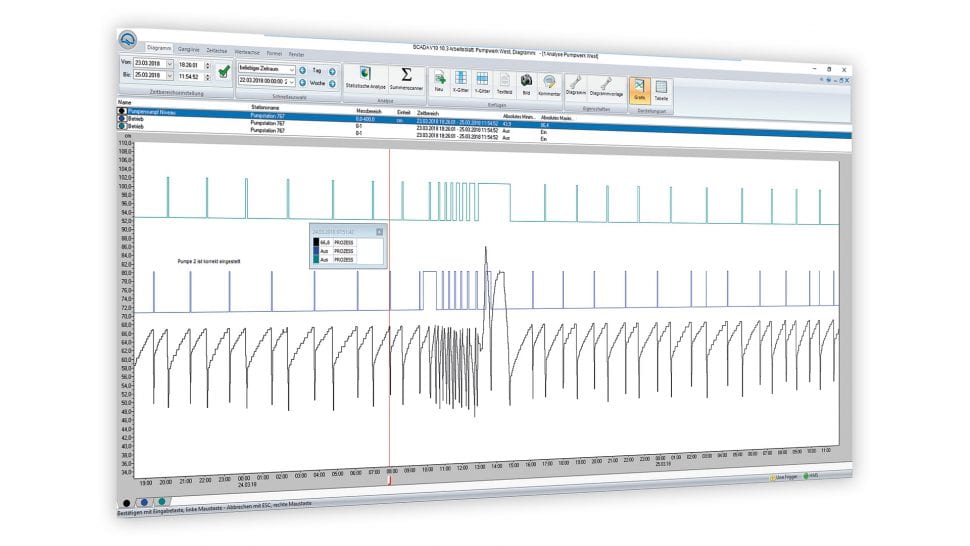
The display of processes in the form of hydrographs is ideal for analysis. A glance at the hydrograph chart is often enough to be able to make an initial assessment. But it is often also necessary to blend various process data in order to be able to evaluate them relative to each other. For this purpose, SCADA V10 offers a high- functioning graphical evaluation capability.
Particularly with an analysis tool with an extensive functional scope, it is especially important for the user interface to be designed ergonomically. Important and frequently used functions can be accessed quickly and easily. There are no limits to the graphical evaluation.
All-time periods are freely adjustable, and any number of hydrographs can be inserted in any number of diagram windows. With a click of the mouse, the sum scanner determines the operating runtimes of units or the flow quantities in the time range shown. A click on the mouse can also store all displayed process data in CSV format and make it available to other applications. Comprehensive, simple, efficient – graphical evaluation in SCADA V10.
YOUR BENEFITS
- Freely selectable time periods
- Unlimited number of hydrographs and diagrams
- Sum scanner for calculating flow quantities
- Calculation of operating runtimes and switching cycles
- Integrated formula editor
- Precipitation total lines
- Direct spreadsheet export
- Hydrographs freely configurable in display and function
Applications
- Process optimisation
- Diagnosis of incidents
- General reporting
- Evidence of self-monitoring


